
Check_MK stellt alle Informationen per Livestatus Schnittstelle bereit. So gut wie alles was man auf der Webseite des Monitorings sehen kann kommt aus Livestatus. Der Sprachsyntax für Abfragen ist LQL -> Livestatus Query Language.
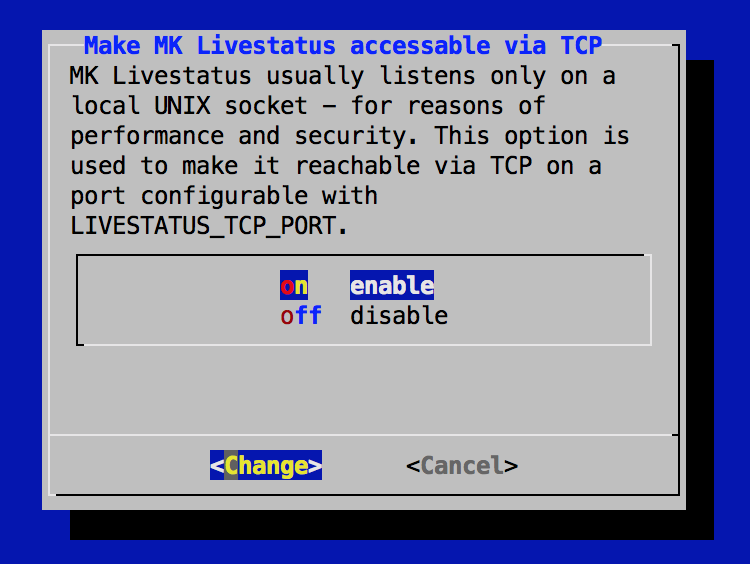
Per Default ist die Livestatus Schnittstelle nur auf dem Host selbst über einen Socket abrufbar. Es gibt aber die Möglichkeit per xinetd die Schnittstelle auch per LAN zur Verfügung zu stellen.
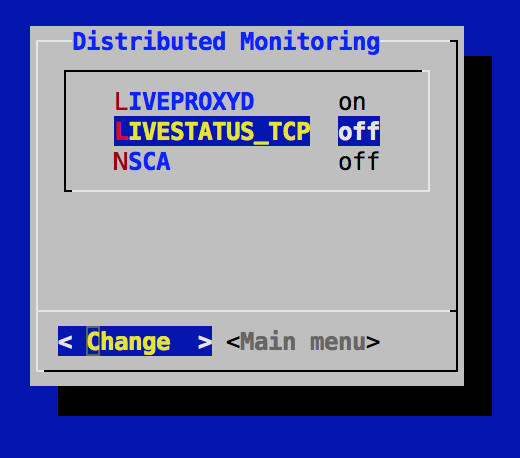
Livestatus Schnittstelle auf LAN (per TCP) aktivieren
OMD stoppen
OMD[dev1]:~$ omd stop
Removing Crontab...OK
Stopping dedicated Apache for site dev1....OK
Stopping Check_MK Micro Core...killing 19502....OK
Stopping rrdcached...waiting for termination...OK
Stopping mknotifyd...killing 19481...
Stopping Livestatus Proxy-Daemon...killing 19474....OK
Stopping mkeventd...killing 19466....OK
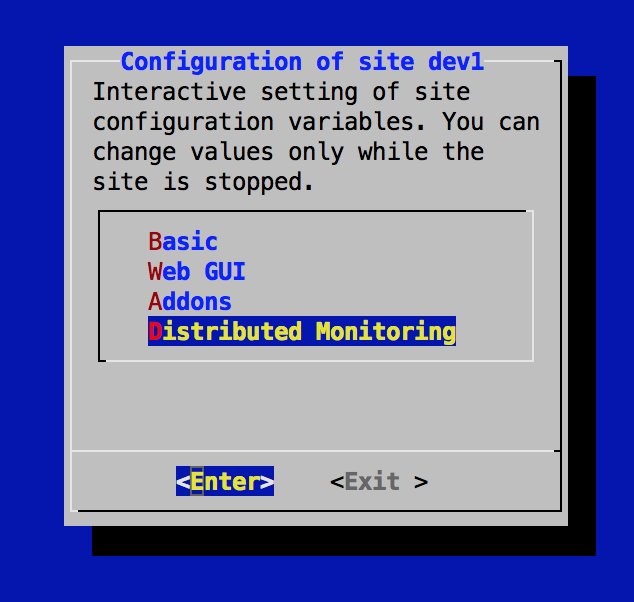
OMD Config starten
OMD[dev1]:~$ omd config
OMD starten
OMD[dev1]:~$ omd start
Starting mkeventd...OK
Starting Livestatus Proxy-Daemon...OK
Starting mknotifyd...OK
Starting rrdcached...OK
Starting Check_MK Micro Core...OK
Starting dedicated Apache for site dev1...OK
Starting xinetd...OK
Initializing Crontab...OK

Erlaubte Hosts auf Livestatus einschränken
Dazu muss ~/etc/xinet.d/mk-livestatus angepasst werden beim Parameter only_from, anschließend muss der xinetd Service neu gestartet werden mit „omd restart xinetd“.
service livestatus
{
  type		= UNLISTED
  socket_type	= stream
  protocol	= tcp
  wait		= no

        # limit to 100 connections per second. Disable 3 secs if above.
  cps             = 100 3

        # set the number of maximum allowed parallel instances of unixcat.
        # Please make sure that this values is at least as high as
        # the number of threads defined with num_client_threads in
        # etc/mk-livestatus/nagios.cfg
        instances       = 500

        # limit the maximum number of simultaneous connections from
        # one source IP address
        per_source      = 250

        # Disable TCP delay, makes connection more responsive
  flags           = NODELAY
# configure the IP address(es) of your Nagios server here:
  only_from       = 127.0.0.1 10.0.20.1 10.0.20.2

# ----------------------------------------------------------
# These parameters are handled and affected by OMD
# Do not change anything beyond this point.

# Disabling is done via omd config set LIVESTATUS_TCP [on/off].
# Do not change this:
  disable		= no

# TCP port number. Can be configure via LIVESTATUS_TCP_PORT
  port		= 6557

# Paths and users. Manual changes here will break some omd
# commands such as 'cp', 'mv' and 'update'. Do not toutch!
  user		= dev1
  server		= /omd/sites/dev1/bin/unixcat
  server_args     = /omd/sites/dev1/tmp/run/live
# ----------------------------------------------------------
}
Livestatus Schnittstelle nutzen
Libraries und Beispiele von Check_MK
Check_MK hat in seinen DOCs für Python, Perl und C++ Libraries und Beispiele an Board. Zu finden sind Sie unter ~/share/doc/check_mk/livestatus/api/
Hier ein einfaches Beispiel für Python:
#!/usr/bin/env python

import os
import sys
import livestatus

try:
    omd_root = os.getenv("OMD_ROOT")
    socket_path = "unix:" + omd_root + "/tmp/run/live"

except:
    sys.stderr.write("This example is indented to run in an OMD site\n")
    sys.stderr.write("Please change socket_path in this example, if you are\n")
    sys.stderr.write("not using OMD.\n")
    sys.exit(1)

department = "testx"

hosts = livestatus.SingleSiteConnection(socket_path).query_table("GET hosts\nColumns: name\nFilter: custom_variables ~~ TAGS %s" % department)

for host in hosts:
    print host[0]
Test Run:
OMD[dev1]:~$ python live.py
router
PHP Library
Check_MK hat selbst keine Library für PHP an Board, ich habe aber bereits folgende erfolgreich eingesetzt.
https://github.com/aashley/nagios-livestatus-client
Beispiel von der Github Seite (siehe Link oben)
<?php

use Nagios\Livestatus\Client;

$options = array(
    'socketType' => 'tcp',
    'socketAddress' => '10.253.14.22',
    'socketPort' => '6557',
);

$client = new Client($options);

$response = $client
    ->get('hosts')
    ->column('host_name')
    ->column('state')
    ->execute();

foreach ($response as $host) {
    print $host[0] . ": " . $host[1] . "\n";
}

$response = $client
    ->get('hosts')
    ->column('host_name')
    ->column('state')
    ->executeAssoc();

foreach ($response as $host) {
    print $host['host_name'] . ": " . $host['state'] . "\n";
}
Auf dem Check_MK Host
root@cmkdev:~# echo -e "GET hosts\nColumns: host_name\n" | unixcat /omd/sites/dev1/tmp/run/live
cluster
node1
router
node3
node2
localhost

In der OMD Umgebung
In der OMD Umgebung steht das Tool lq zur Verfügung welches ebenfalls ein unixcat macht.
OMD[dev1]:~$ lq "GET hosts\nColumns: host_name\n"
cluster
node1
router
node3
node2
localhost
per TCP von Remote Host
Der Standardport ist tcp/6557.
root@cmkdev2:~# echo -e "GET hosts\nColumns: host_name\n" | netcat 10.211.55.13 6557
cluster
node1
router
node3
node2
localhost
Welche Tabellen / Spalten (Columns) gibt es?
Das lässt sich per Livestatus abfragen:
OMD[dev1]:~$ lq "GET columns\nFilter: table = hosts"

description;name;table;type
Whether passive host checks are accepted (0/1);accept_passive_checks;hosts;int
Whether the current problem has been acknowledged (0/1);acknowledged;hosts;int
Type of acknowledgement (0: none, 1: normal, 2: sticky);acknowledgement_type;hosts;int
An optional URL to custom actions or information about this host;action_url;hosts;string
The same as action_url, but with the most important macros expanded;action_url_expanded;hosts;string
Whether checks of the object are enabled (0/1);active_checks_enabled;hosts;int
IP address;address;hosts;string
An alias name for the host;alias;hosts;string
Logical command name for active checks;check_command;hosts;string
Logical command name for active checks, with macros expanded;check_command_expanded;hosts;string
Whether to check to send a recovery notification when flapping stops (0/1), not supported by CMC;check_flapping_recovery_notification;hosts;int
Whether freshness checks are enabled (0/1);check_freshness;hosts;int
Number of basic interval lengths between two scheduled checks;check_interval;hosts;float
The current check option, forced, normal, freshness (0-2), not supported by CMC;check_options;hosts;int
Time period in which this object will be checked. If empty then the check will always be executed.;check_period;hosts;string
Type of check (0: active, 1: passive);check_type;hosts;int
Whether checks of the object are enabled (0/1);checks_enabled;hosts;int
A list of all direct children of the host;childs;hosts;list
... gekürzt ...
Hilfe beim Zusammenstellen eines LQL Query
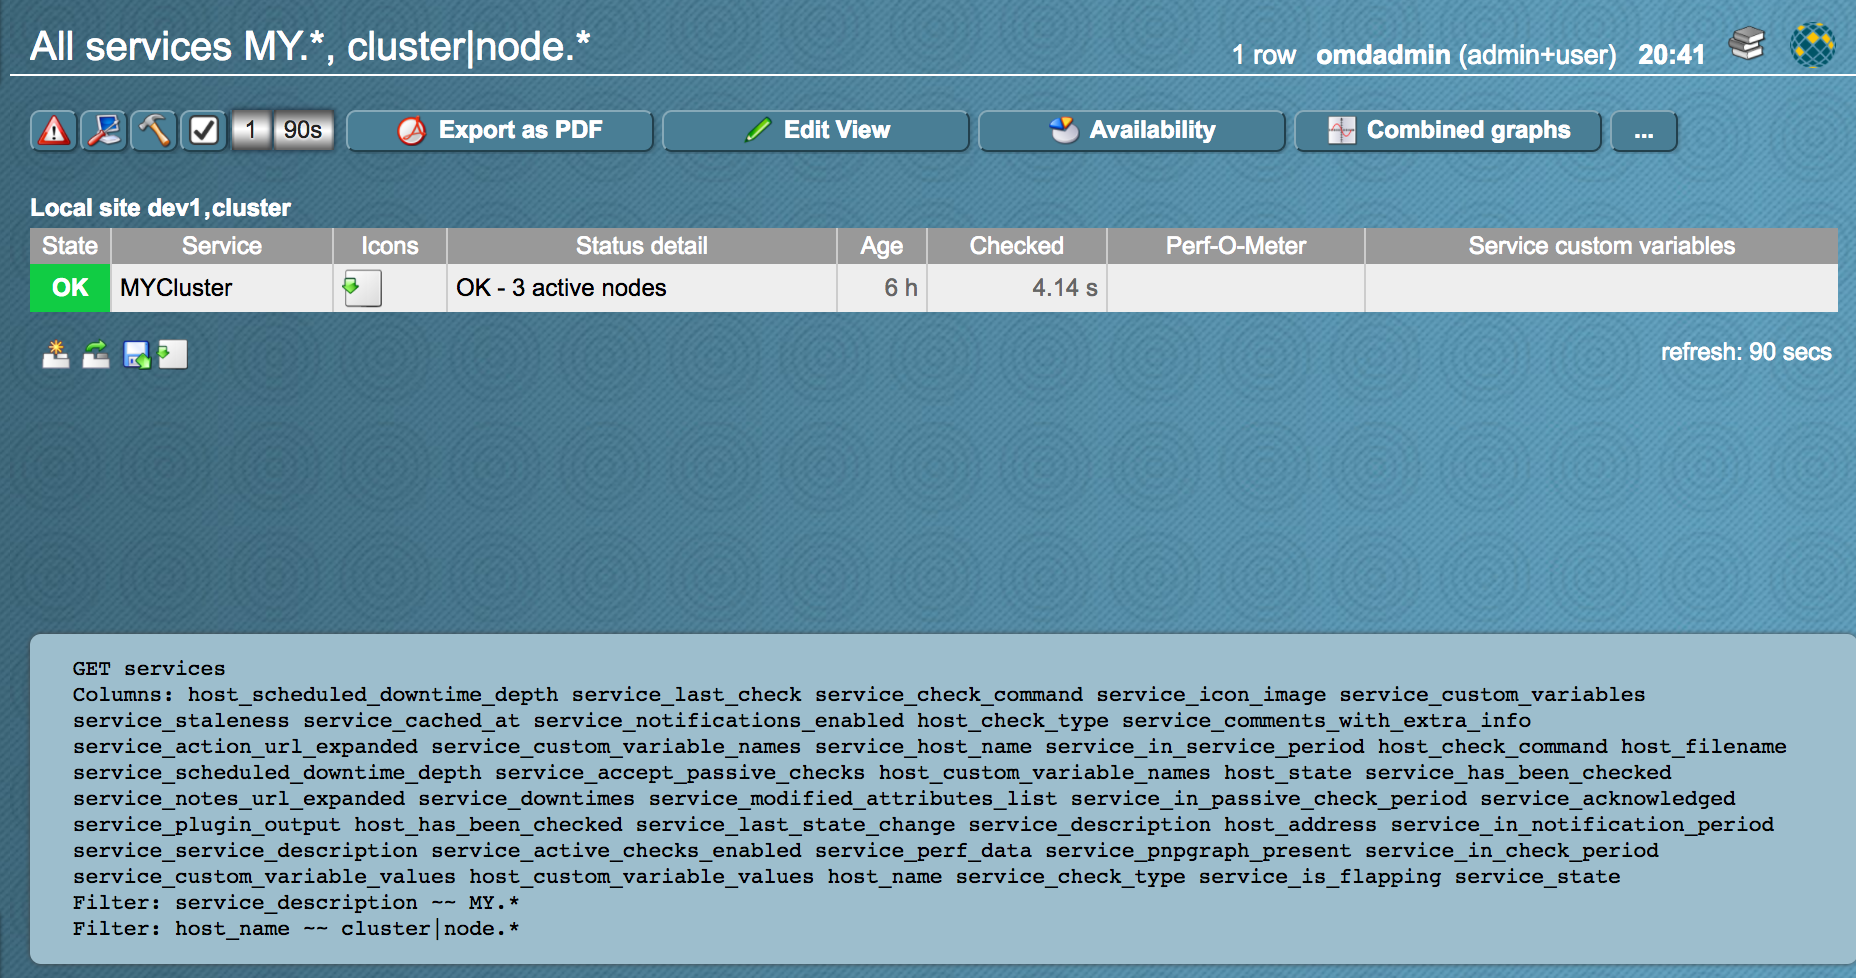
Da LQL Queries sehr komplex werden können kann man das Check_MK zur Hilfe nehmen. Dazu muss in den Global Settings „Debug Livestatus queries“ aktivieren.
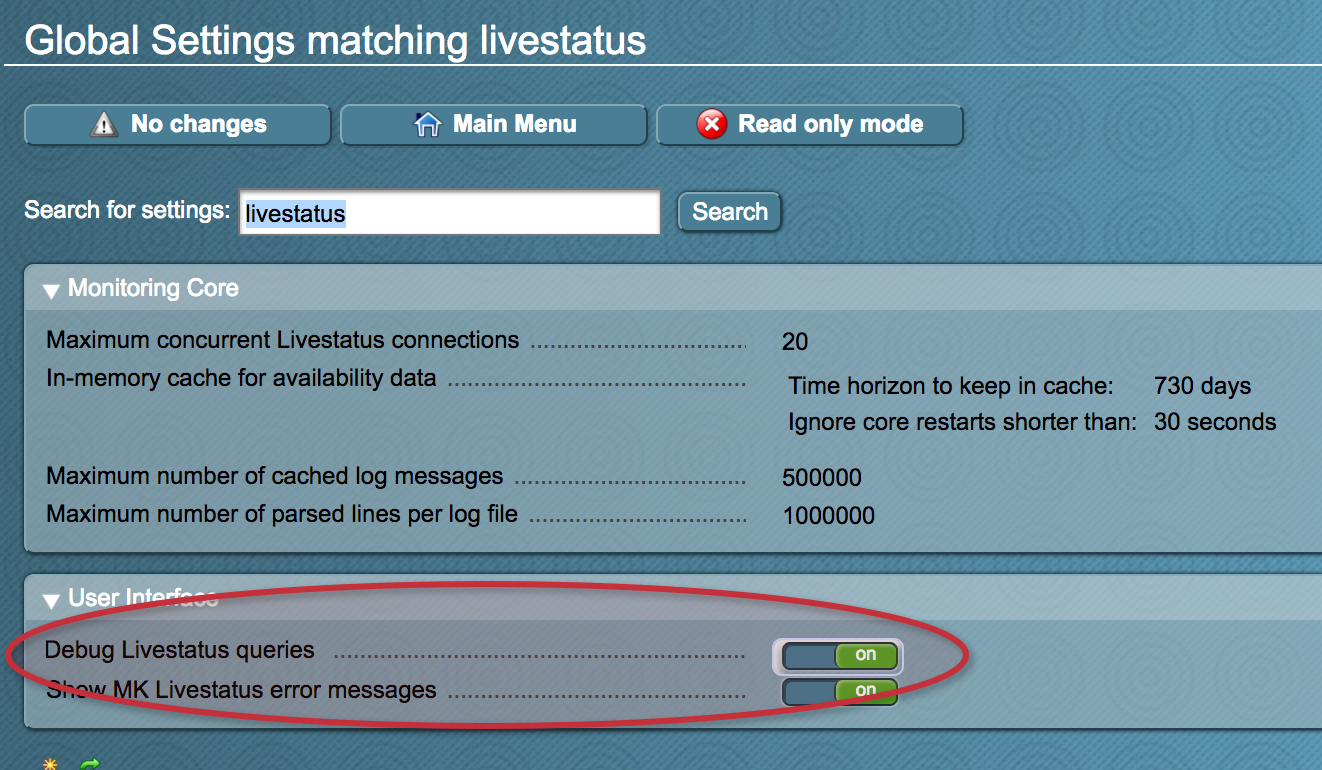
Anschließend kann man sich einen View zusammenstellen mit den gewünschten Daten, der LQL Query wird unten an der Webseite angezeigt der für die Abfrage verwendet wurde.
Mehr dazu bei Check_MK / Mathias Kettner
Mathias Kettner hat Livestatus entwickelt und bietet auch eine sehr gute Dokumentation dazu an:
https://mathias-kettner.de/checkmk_livestatus.html
Have fun 😉